
Competitor pricing vs MSRP: see where every dealer lands, from website to last quote

Ben
Every dealer advertises a price. What matters is the price a shopper actually gets once they ask, and how much it moves as they push back. Until now, answering that meant reading through shop notes and quote emails one at a time. The new Pricing vs MSRP page puts it on one screen: for each competitor you shop, how far below MSRP they price on their website, in their first quote and in their last quote, with your own store on the same scale.
You'll find it in the sidebar under Mystery Shops > Pricing vs MSRP.
Three prices for every competitor
When our shoppers start a shop, they record each competitor's advertised price along with the fees and rebates listed on the site. Every quote that comes back after that is saved as well. The page lines those three points up:
- Website: the advertised sales price before fees and rebates.
- First quote: the first price the dealer sent back.
- Last quote: where they ended up after follow-up.
Each price is measured against the MSRP of the vehicle it priced, in dollars and as a percent. Rebates are left out of that number and shown in their own column. Fees get their own column too, so a low price padded with a large add-on doesn't look like a deep discount.
Why percent of MSRP
A $1,000 discount on a $25,000 sedan is 4% off. The same $1,000 on a $60,000 truck is under 2%. If you average dollars across a month of shops, the mix of vehicles shopped can hide what a dealer is really doing. Measuring every price as a percent of its own MSRP lets you compare a dealer's compact quotes and SUV quotes on the same footing. The dollar amounts are still there when you want them.
When the page compares two prices, such as a first quote against the website, the difference is shown in percentage points. Here's a simple example on a $38,000 vehicle:
- Website: $36,860, or 3.0% below MSRP
- First quote: $36,632, or 3.6% below, which is 0.6 points deeper than the website
- Last quote: $36,290, or 4.5% below, which is 1.5 points deeper than the website and 0.9 points deeper than the first quote
That tells you this dealer advertises close to MSRP, opens a little lower, and gives up almost another point when pushed.
See where everyone lands
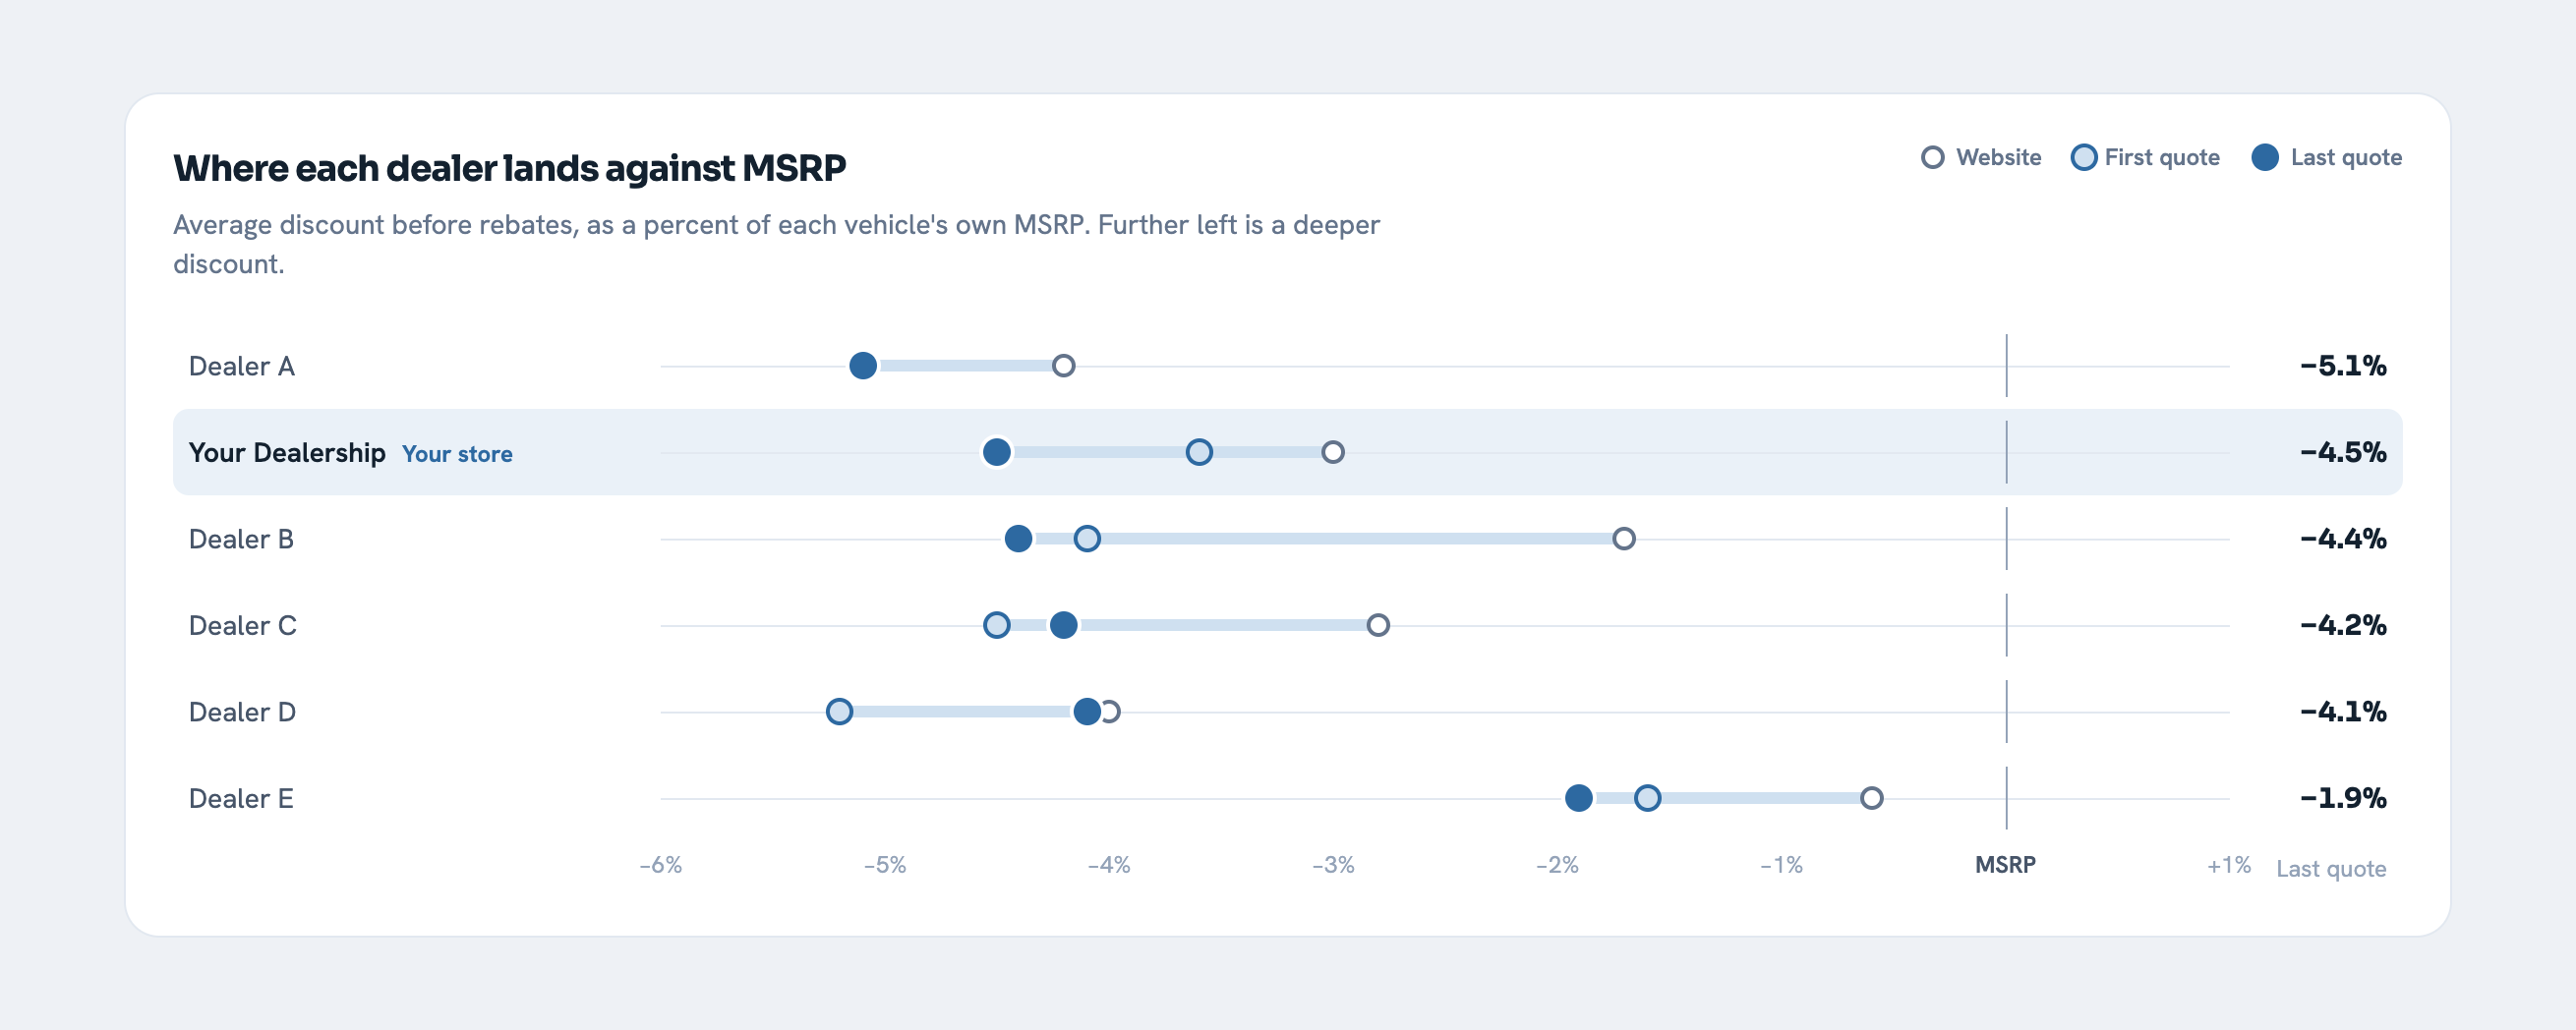
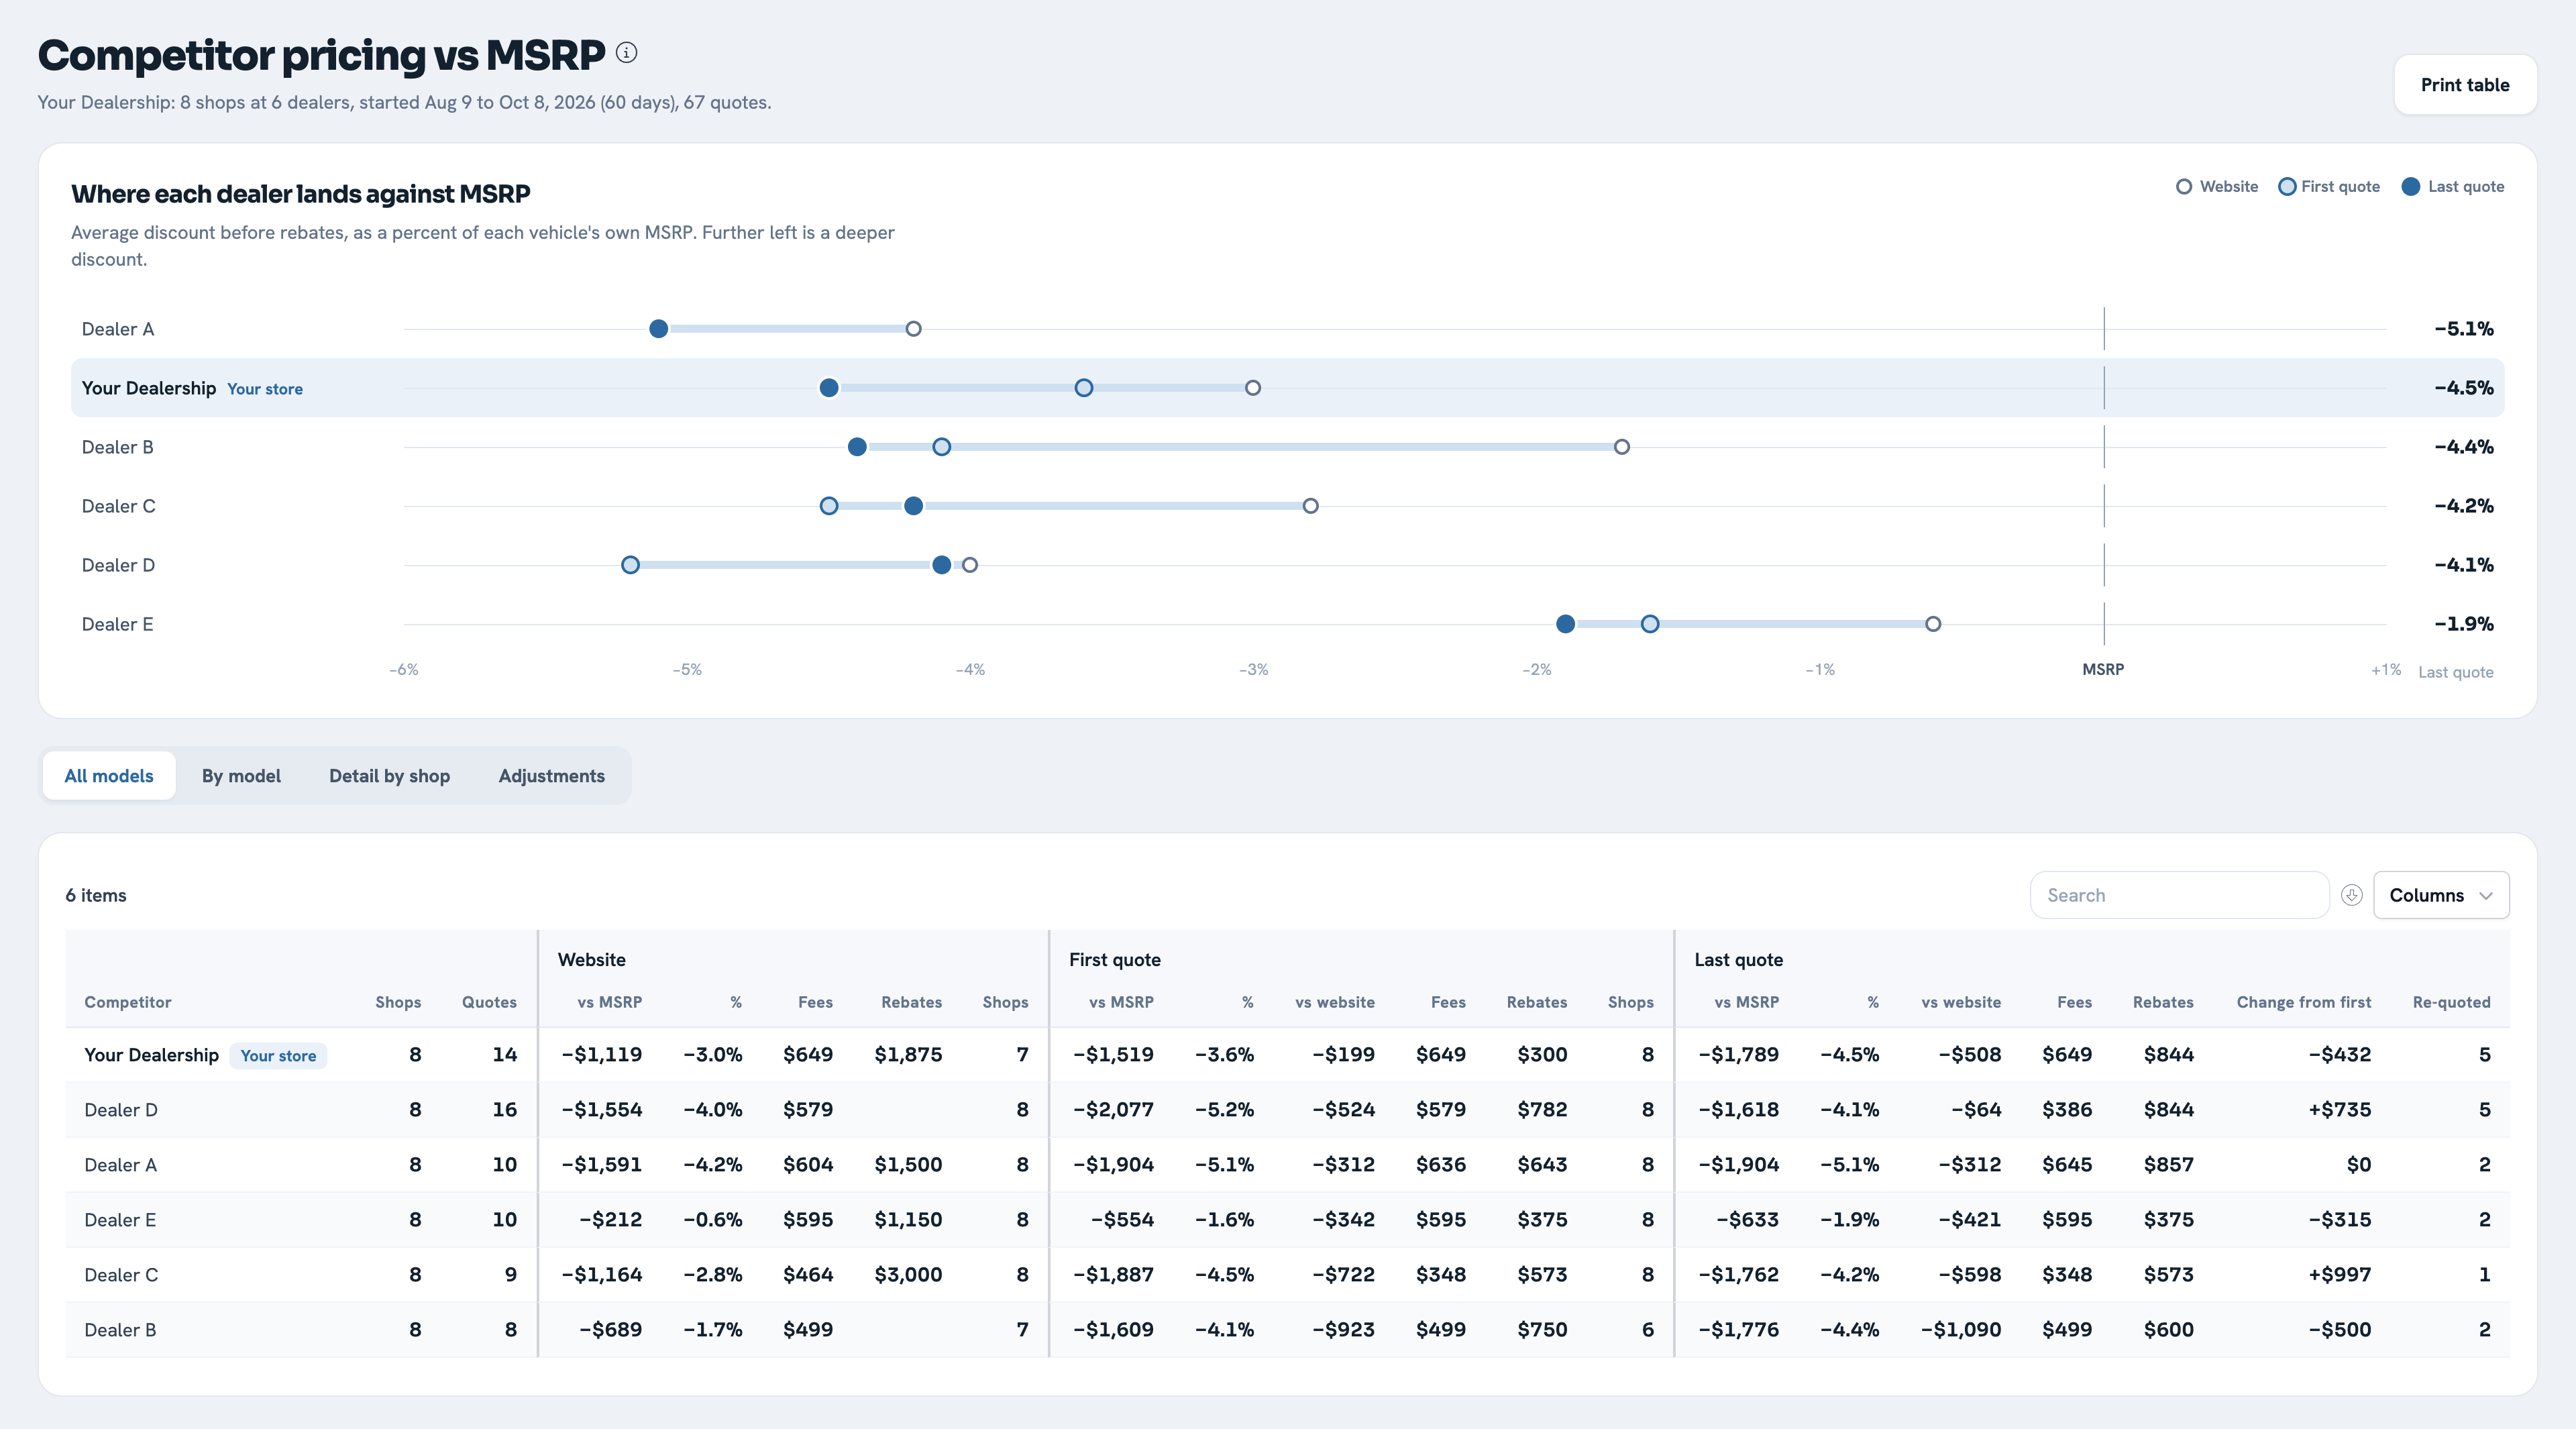
At the top of the page, one row per dealer shows the website price, first quote and last quote as points on a single scale, with MSRP marked. Your store is highlighted, and the rows are sorted by last quote, so the dealer giving the deepest final discount is at the top. In a few seconds you can see who advertises high and quotes low, who holds firm, and where you sit.
Dig into the numbers
Below the chart, the tables break it down four ways:
- All models: one row per competitor with averages for the website, first quote and last quote, plus fees, rebates, how far quotes moved from the website, and how many shops were re-quoted.
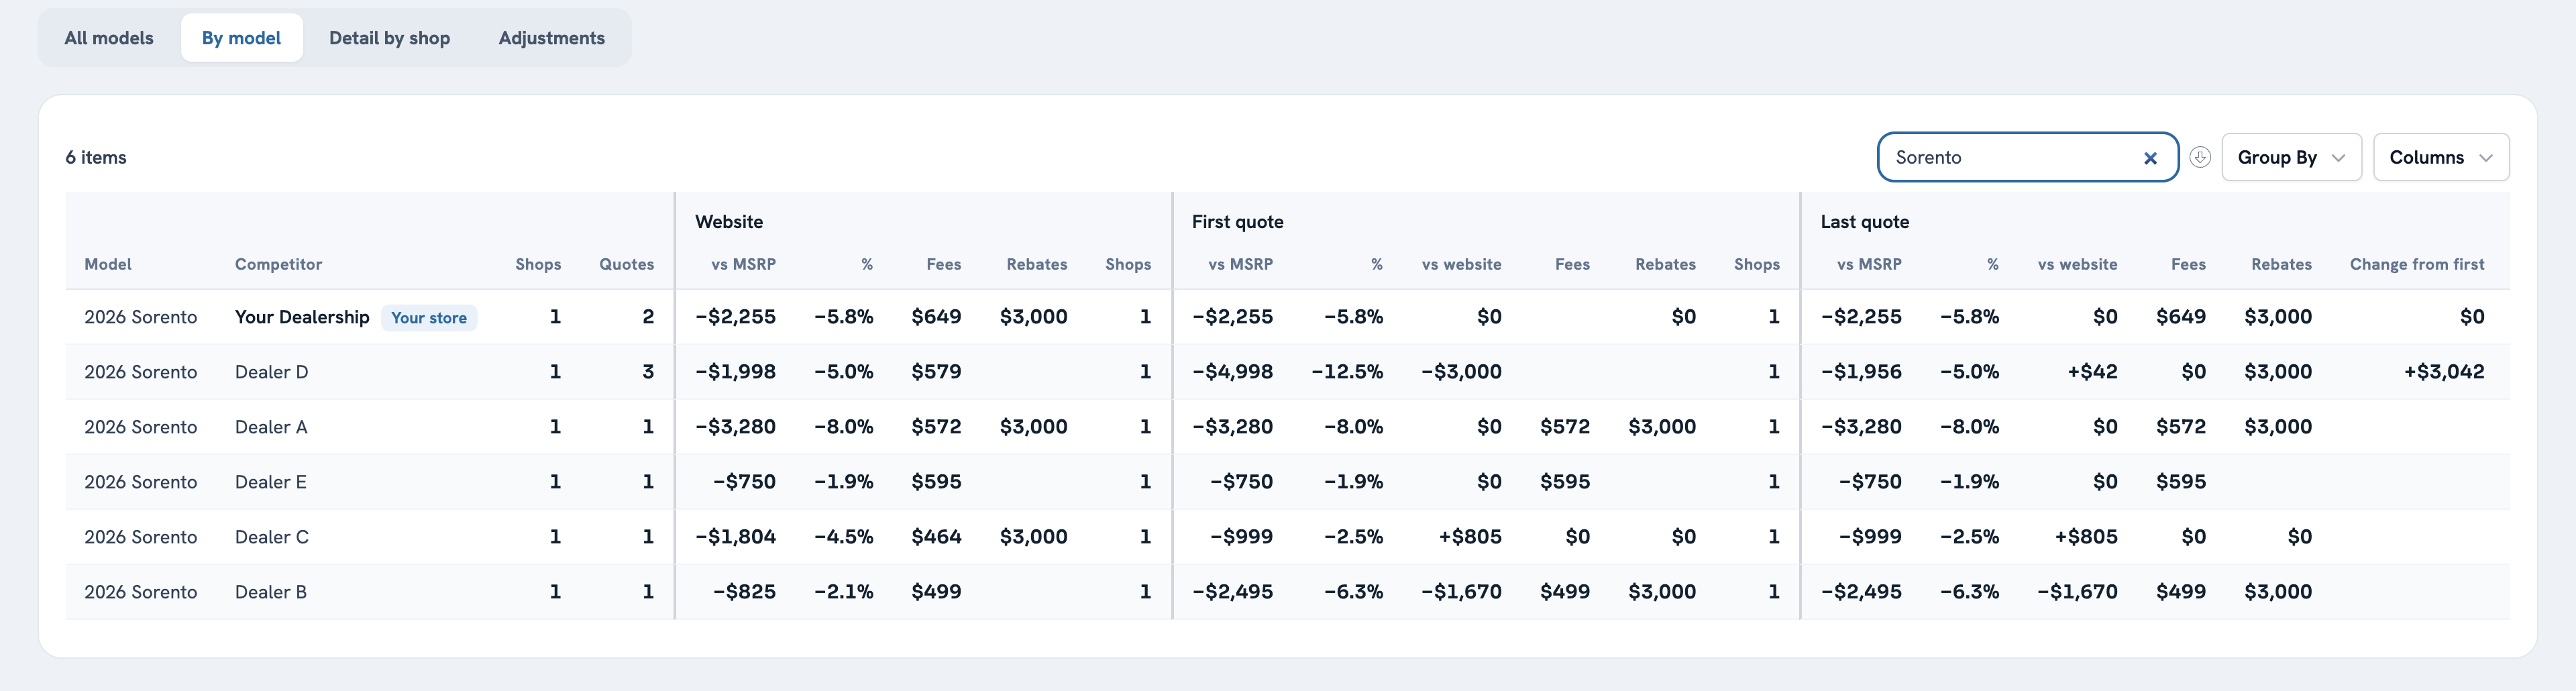
- By model: the same view for each model, so you can spot a dealer who is aggressive on one nameplate and firm on another.
- Detail by shop: every shop behind the averages, so you can check any number against the quotes themselves.
- Adjustments: anything the page corrected or set aside, and why. For example, when a quote matches the website's price with the admin fee already included, the fee is taken out so the quote is compared fairly.
Every table can be sorted, searched and downloaded. You can hide columns you don't need, and Print table prints the table you're looking at, running across pages when it's long.
Is the market moving?
Pick a window of 30, 60 or 90 days, or set your own dates. The Compare periods tab sets that window against the same number of days just before it, for each competitor and for each model. If a competitor's last quotes went from 2.5% below MSRP to 4% below, you'll see a 1.5-point move, and you'll see it before your customers tell you about it.
Leave out the vehicles that skew the picture
Specialty and limited vehicles often sell at or above MSRP, and a few of them in a month can pull every average up. Use Exclude vehicles to leave them out. The list shows every vehicle shopped in the period, by trim, and the exclusion applies to the whole page: the chart, every table, the period comparison and the printout.
Getting started
The page is available now to stores using Dealer Driven Data mystery shopping. Pick your store and a date range and the page builds from your shops right away; there's nothing to set up. If you don't see Pricing vs MSRP in your sidebar, or you'd like us to walk through it with your team, contact us.